By Joseph D’Aleo, CCM, AMS Fellow
On June 23, 1988 James Hansen, Astronomer by degree but climatologist by self appointment testified in front of congress. It was an orchestrated testimony coordinated by Senator Al Gore and a Senator from Colorado, Tim Wirth (now running Ted Turner’s UN Foundation) who admitted they picked the day after calling the National Weather Service to ensure it was a hot day. He admitted proudly later they opened all the windows the night before, making air conditioning ineffective and making sure all involved including Hansen would be seen mopping their brow for maximum effect. Hansen testified “Number one, the earth is warmer in 1988 than at any time in the history of instrumental measurements. Number two, the global warming is now large enough that we can ascribe, with a high degree of confidence, a cause-and-effect relationship to the greenhouse effect.”
See in the story below how hard Hansen has worked to try and make his prognostication verify by manipulating data. By his own comments to the UK Guardian “When you are in that kind of position, as the CEO of one the primary players who have been putting out misinformation even via organisations that affect what gets into school textbooks, then I think that’s a crime.” Well the disinformation that comprises the GISS data then by his own words is a crime, and in his own words he “should be put on trial for high crimes against humanity and nature”.
Here is the plot of actual NASA global satellite monthly temperatures since June 1988. Note the anomaly in May 2008 was lower than in June 1988 by nearly 0.3C. Of course, we don’t have June 2008 numbers yet. Please note I am not saying that cooling began in 1988. Satellites show clearly that since 1979 there was a moderate warming which peaked in 1998. A cooling has taken place the last 6 to 7 years. Global station and ocean data with all its warts shows the warming from the early 1900s to the 1930s, cooling from the 1940s to the 1970s then warming again peaking in 1998. I am just making an observation that it is ironic that 20 years after his first testimony about global warming, it is half a degree F oooler globally, not supporting the drastic measure he advocates. Also we can explain not only the trends but each spike or dip with some natural phenomena as we have shown in recent posts.
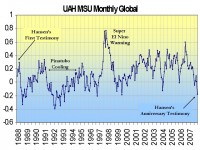
See larger image here
His testimony will no doubt include reference to upcoming or ongoing dangerous rises in sea level and ignore the data. His radio interview today on the Diane Rehm show this AM on WAMU in Washington DC, (audio links here) provides a preview of what he will tell congress.
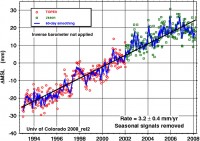
See larger image here
He will also no doubt repeat his claim he is being muzzled. He confuses a muzzle with a megaphone as shown by this table of actual Hansen media references by year (thanks to Roger Pielke Jr. on Prometheus).
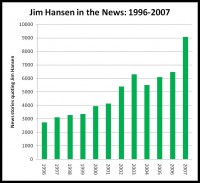
See larger image here.
Today unlike in June 1988, temperatures will be near normal in DC with temperatures in the 70s and 80s with thunderstorms. The last two weeks have averaged 2 degrees below normal. See much more on Hansen and history with this movement here.
Correct the Corrections: The GISS Urban AdjustmentBy Ken Gregory of Friends of Science
NASA’s Goddard Institute of Space Studies (GISS) publishes a global temperature index. The temperature record is contaminated by the effects of urban development and land use changes. NASA applies an “urbanization adjustment” to adjust the temperature histories to eliminate these effects. The resulting GISS temperature index is supposed to represent what the temperatures would have been in the absence of urbanization and land use changes. Most scientists assume that these adjustments are done correctly. The index is used to show that CO2 emissions are causing climate change.
An audit by researcher Steve McIntyre reveals that NASA has made urban adjustments of temperature data in its GISS temperature record in the wrong direction. The temperatures in urban areas are generally warmer than in rural areas. McIntyre classified the 7364 weather stations in the GISS world-wide network into various categories depending on the direction of the urban adjustment. NASA has applied a “negative urban adjustment” to 45% of the urban station measurements (where adjustments are made), meaning that the adjustments makes the warming trends steeper. The table below shows the number of negative and positive adjustments made to the station temperature trends.
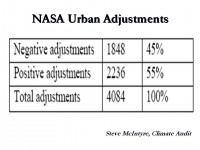
See full size image here
The urban adjustment is supposed to remove the effects of urbanization, but the NASA negative adjustments increases the urbanization effects. The result is that the surface temperature trend utilized by the International Panel on Climate Change (IPCC) is exaggerated.
See full size image here
Satellite data is free of urbanization effects and provide truly global coverage continually. Previous problems with satellite drift affecting temperature calculations have been corrected. Newer satellites have station keeping capability and do not drift. The satellite data is much superior to land measurement. The satellite global temperature trend from 2002 to May 2008 is a decline of 0.25 Celsius per decade, significant global cooling for over 6 years. Read Ken’s full report here. See this informative post by Steve McIntyre here on the NASA urban fiasco. Also other reasons why GISS is warmest here.
By Ken Gregory of Friends of Science
The paper, Greenhouse Effect in Semi-Transparent Planetary Atmospheres by Ferenc M. Miskolczi shows that the current greenhouse effect equations are incomplete because they do not include the correct boundary conditions. The new theory presented in this paper shows that the atmosphere maintains a “saturated” greenhouse effect, controlled by water vapor content. There is no physics, no equations in the models that determines the strength of the greenhouse effect. Parameters are just set to obtain the observed temperature. The greenhouse effect is dominated by water vapour, so how it changes with increasing CO2 is critical. All the General Circulation Models (GCM) or more commonly called Global Climate Models just set: Relative humidity = constant (or various parameters to achieve the same effect.)
There is no physics in support of this assumption, and no way to calculate its value from first principles. This assumption means that if temperatures increase for any reason, the amount of water vapour in the atmosphere increases. But water vapor is the most important greenhouse gas, so the greenhouse effect becomes stronger and temperatures increase more. The current theory does not determine this - it is only an assumption.
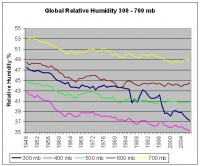
Here is a graph of global average annual relative humidity at various elevations in the atmosphere expressed in milli-bars (mb) from 300 mb to 700 mb for the period 1948 to 2007. The data is from the NOAA Earth System Research Laboratory here.
See larger graph here
Indeed a NASA-funded study here found some climate models might be overestimating the amount of water vapor entering the atmosphere as the Earth warms. They found the increases in water vapor were not as high as many climate-forecasting computer models have assumed. In most computer models relative humidity tends to remain fixed at current levels. “The increases in water vapor with warmer temperatures are not large enough to maintain a constant relative humidity,” Minschwaner said.
Dr. Roy Spencer’s article Global Warming and Nature’s Thermostat here, describes the role of precipitation systems in controlling the greenhouse effect. It is an extension of extension of Richard Lindzen’s “Infrared Iris” hypothesis. Dr. Spencer says we don’t know why the greenhouse effect is limited to its current value. The new Miskolczi theory of the greenhouse effect provides the detailed explanation of why the greenhouse effect is limited to its current value for a constant external Sun forcing. Adding CO2 to the atmosphere just replaces an equivalent amount of water vapour to maintain a constant greenhouse effect.
Read much more of this detailed review here.
By Beth Bragg, Anchorage Daily News
After solstice today, it’s all downhill to winter. At 3:59 this afternoon, the sun will reach its northernmost point above the celestial equator and we’ll mark the official summer solstice. Many calendars note the solstice by calling it the first day of summer, but Alaskans know better. Today at 3:59 p.m., Alaska will make a U-turn and head straight toward winter as days start getting shorter.
Which is a shame, seeing how summer so far has been Missing in Action.
We are deep in June and, as of Thursday, the temperature has yet to hit 70 degrees at the National Weather Service’s observation point near the airport, where daily highs and lows are recorded. It hit 67 on Tuesday near the airport, the highest official. We haven’t had to wait this long for a 70-degree day since 1993, when the mercury hit the 70s for the first time on June 19th. Welcome to a record-breaker. Rah.
Beth Schlabaugh, president of the Alaska Master Gardeners Association’s Anchorage chapter, said lots of green things are off kilter because of summer’s delay."Definitely we’re seeing a much later season this year,” she said. “Everyone has talked to me about things being two to three weeks behind schedule.” Roses have been late to break dormancy, she said. Irises and lilacs are only now showing up, and not everywhere. Seeds are slow to germinate.
The cool weather will be a blessing to runners who will spend Saturday morning running 26.2 miles in the Mayor’s Midnight Sun Marathon. “Probably the best weather is somewhere between 40 and 60 degrees,” said Will Kimball, a two-time winner of the marathon. “You want cool.” Kimball is calling this “the summer of the cold breeze.” “Often it looks pleasant,” he said, “but that breeze has got a cold nip to it.”
See full time image here.
By Red Cavaney, Wall Street Journal
A bill introduced in Congress this week would “compel” oil and natural gas companies to produce from federal lands they are leasing. If only it were that easy to find and produce oil. Imagine, an act of Congress that could do what geology could not. These lawmakers ask why oil and gas companies want more access to federal lands to drill if they aren’t using all of the 68 million acres they already have? Anyone with even the most basic understanding of how oil and natural gas are produced - and this should include many members of Congress - knows that claims of “idle” leases are a diversionary feint.
Our companies have made tremendous strides in developing cutting-edge exploration technology. But they are not magicians. They cannot produce oil or natural gas where it does not exist. A significant percentage of federal leases simply may not contain oil and natural gas, especially in commercial quantities. As I’ve often said, the first step in our business is called “exploration” for a reason. Exploration is time consuming, very costly and involves a great deal of risk. And it happens in the minds of those who use the undeveloped-lease argument as a smokescreen to mask their intent to keep America’s vast energy resources locked up underground, despite increasingly strong consumer demand for oil and natural gas. For exploration to take place, our companies need access to the areas - offshore and onshore - that we know have the potential to produce the oil and natural gas consumers will need, if ours is to remain a viable economy in an increasingly competitive global marketplace.
Today’s short-term need was yesterday’s long-term opportunity. If Congress had acted on that opportunity years ago, America would not be in the energy bind it finds itself in today. Working with industry, Congress now has the opportunity to help secure America’s energy future. It should not miss the chance again. Read more here.
Mr. Cavaney is president and CEO of the American Petroleum Institute, the trade association that represents America’s oil and natural gas industry.
By Joseph D’Aleo, CCM, AMS Fellow
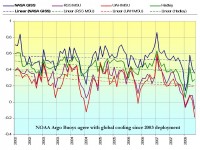
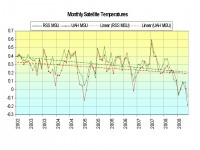
All the data sources have now reported for global May temperatures with Hadley coming in today. University of Alabama MSU was the coldest with a -0.18C. RSS MSS was a close second with -0.083C. Hadley had a +0.278C and NASA GISS came in at +0.36C.
UAH and RSS MSU satellite data uses a base period (period over which monthly climatological averages are computed for the purposes of then determining departures from normal for any given month) of 1979-1998. NASA GISS uses the coldest period of the last century 1951 to 1980. Hadley uses 1961 to 1990 as a base period (with two cold decades and one increasingly warm). NCDC in their USHCN uses the entire period of record (back to 1895), in my mind probably the most reasonable since it includes two cold and two warm periods. Your local NWS uses the latest three complete decades (1971 to 2000) for it averages and to compute departures from normal. That is the long established standard for the local offices. You see there are no agreed to standards for the longer term records, so at least for anomalies, we are always comparing apples with oranges with pears with plums.
Obviously satellite provides the best coverage of the all but the polar land and oceans. The other data bases in addition to their differences in base periods, are at the mercy of the country governments data collection and have huge holes in the data over land and very spotty imperfect ocean temperature measurements, especially in the Southern Hemisphere.
There are other major issues with the global data bases. 2/3rds pf the world’s station dropped out after 1990 and the number of missing months in places like Asia and Africa increased tenfold. Siting has been shown so well by Anthony Watts at http://surfacestations.org to ba an issue with more than 2/3rds of the United States stations poorly sited. The importance of urbanization is underestimated thanks to the flawed research of Peterson and Parker in all the global surface data bases. Numerous peer-reviewed studies have shown that surface data bases may overestimate warming by up to 50%. And then there is the issue of the oceans which each of the data centers treat differently and now will likely change the data to better reflect a more gradual changeover from buckets to ship intakes. See more on that issue in Steve McIntyre’s Lost at Sea here.

See larger image here
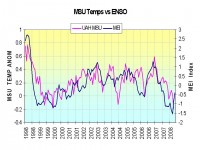
All four plotted data sets, yes even GISS, shows a decline since 2002. GISS has the largest positive anomaly because it uses the coldest base period. Satellites, the coldest since, their base period (by chance) was in the warmest decades (of the positive PDO with most El Ninos). Note how well the temperature variations have tied to the variations of ENSO (El Nino) in just the last decade, in this case using the Mulitvariate ENSO Index (MEI) of CDC’s Wolter. ENSO and the longer term PDO are the real drivers for decadal climate change, used to support the greenhouse gang from 1979 to around 2002 but now has them on the defensive. If the cooling continues as we believe it will, they will have to resort to even more creative data manipulation to keep the hoax alive. But this will become increasingly apparent because they have no control over the satellite measurements.
See larger image here
NASA Mission Seas
Icecap Note: You will note the Hansen influence on this story. Instead of just reporting the facts, they have to repeat the talking points of the alarmist agenda. We support NASA’s and NOAA’s technology attempts and the work of Willis et al. We hope the data from the new satellites is not subject to the so called “quality assurance” adjustments GISS and NCDC are so famous for with their outlier GISS/GHCN data bases. Let the data speak for itself.
Global sea level has risen 20 centimeters (eight inches) in the past 100 years, and the rate of rise is predicted to accelerate as Earth warms. Melting ice from Greenland and Antarctica could raise sea level more than one meter (three feet) over the next century. One obvious threat is inundation, or loss of land to rising water. Other consequences are more complex, but equally problematic--a warmer ocean can fuel more intense storms; environmental changes can adversely affect ocean life, such as coral reefs and fisheries; and alterations in ocean currents can trigger radical changes in Earth’s climate.
The best hope for anticipating the future is to understand the past and present. For global sea level, the first step has been to measure it accurately, a challenge in itself. Records of global sea level in the past come from averaging tide gauge readings from many locations. But since the launch of Topex/Poseidon in 1992, followed by Jason-1 in 2001, scientists have had a precise measurement of the height of the global ocean every 10 days. Now the Ocean Surface Topography Mission/Jason-2, scheduled to launch June 20 from California’s Vandenberg Air Force Base, will continue this critical task.
For a closer look at ocean heat, scientists turn to temperature and other measurements made by the thousands of Argo floats. “The Argo profilers give us a good representation of the upper 1,000 meters (3,281 feet) of the ocean,” Chambers said. “And since altimeters and Grace measure the total ocean, using what we know about the upper ocean from Argo gives us an idea about what’s going on below in the deep ocean, about which we have little data.”
“We know the basics of sea level rise very well,” said JPL oceanographer and climate scientist Josh Willis. But several critical elements still need to be resolved, he stressed. “Everything doesn’t quite add up yet.” For example, in a recent study, Willis, Chambers and their colleague Steven Nerem of the Colorado Center for Astrodynamics Research in Boulder, compared the amount of ocean warming during 2003 to 2007 observed by the Argo buoys with the amount of warming calculated by combining Grace and Jason-1 altimeter data. While the two measurements closely matched with regard to seasonal ups and downs, they didn’t agree at all on the total amount of warming. In fact, the Argo data showed no warming at all, while the combined Jason and Grace data did.
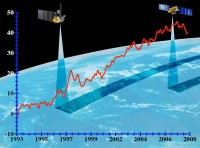
See NASA graph. Notice downturn in last year. See larger image here

See larger image here
Again this may be the result of the ocean cooling the last year from the flip of the PDO and La Nina which causes compression and/or growth of the Antarctic and maybe even Greenland ice sheets.
By John Coleman - As Presented to the San Diego Chamber of Commerce
You may want to give credit where credit is due to Al Gore and his global warming campaign the next time you fill your car with gasoline, because there is a direct connection between Global Warming and four dollar a gallon gas. It is shocking, but true, to learn that the entire Global Warming frenzy is based on the environmentalist’s attack on fossil fuels, particularly gasoline. All this big time science, international meetings, thick research papers, dire threats for the future; all of it, comes down to their claim that the carbon dioxide in the exhaust from your car and in the smoke stacks from our power plants is destroying the climate of planet Earth. What an amazing fraud; what a scam.
The future of our civilization lies in the balance. That’s the battle cry of the High Priest of Global Warming Al Gore and his fellow, agenda driven disciples as they predict a calamitous outcome from anthropogenic global warming. According to Mr. Gore the polar ice caps will collapse and melt and sea levels will rise 20 feet inundating the coastal cities making 100 million of us refugees. Vice President Gore tells us numerous Pacific islands will be totally submerged and uninhabitable. He tells us global warming will disrupt the circulation of the ocean waters, dramatically changing climates, throwing the world food supply into chaos. He tells us global warming will turn hurricanes into super storms, produce droughts, wipe out the polar bears and result in bleaching of coral reefs. He tells us tropical diseases will spread to mid latitudes and heat waves will kill tens of thousands. He preaches to us that we must change our lives and eliminate fossil fuels or face the dire consequences. The future of our civilization is in the balance. With a preacher’s zeal, Mr. Gore sets out to strike terror into us and our children and make us feel we are all complicit in the potential demise of the planet. Mr. Gore and his crowd would have us believe that the activities of man have overwhelmed nature during this interglacial period and are producing an unprecedented, out of control warming.
Here is my rebuttal. There is no significant man made global warming. There has not been any in the past, there is none now and there is no reason to fear any in the future. The climate of Earth is changing. It has always changed. But mankind’s activities have not overwhelmed or significantly modified the natural forces.
It is simply not happening. Worldwide there was a significant natural warming trend in the 1980’s and 1990’s as a Solar cycle peaked with lots of sunspots and solar flares. That ended in 1998 and now the Sun has gone quiet with fewer and fewer Sun spots, and the global temperatures have gone into decline. Earth has cooled for almost ten straight years. So, I ask Al Gore, where’s the global warming? If Al Gore and his global warming scare dictates the future policy of our governments, the current economic downturn could indeed become a recession, drift into a depression and our modern civilization could fall into an abyss. And it would largely be a direct result of the global warming frenzy.
My mission, in what is left of a long and exciting lifetime, is to stamp out this Global Warming silliness and let all of us get on with enjoying our lives and loving our planet, Earth. Read John’s full speech here. Update: See this video on Red Eye interviewing John Coleman here.
John Coleman was the original founder of cable TV’s The Weather Channel and has been a television meteorologist in Chicago, New York and now San Diego.

By Joseph D’Aleo, CCM
In the latest in a series of predictable news stories gobbled up by an all too willing media, an environmental group Clean Wisconsin today claimed that the disastrous floods that ravaged southern Wisconsin this week are consistent with global warming predictions in the January 2007 Clean Wisconsin report. The report, “Global Warming Arrives in Wisconsin,” forecast that global warming would lead to increased instances of severe droughts, more intense floods and increased snowfall.
Alarmists have adopted the can’t lose position that all extremes of weather - cold, warm, wet or dry are all due to global warming. They blamed the frequent tornadoes of the late winter and spring on global warming even though the number was not at all atypical of a La Nina year. Southern Wisconsin and much of the Midwest has had a rough winter and spring but it has been the antithesis of global warming.
Wisconsin had its 33 coldest winter on record, nearby Iowa its 19th coldest in 114 years. The cool weather continued into the spring with the 22nd coldest spring on record in Wisconsin and 24th in Iowa. Madison, Wisconsin had the snowiest winter on record, topping 100 inches for the first time ever. See summary and map here
The record snows, severe weather and heavy rainfall has been the result of rapid COOLING in the northern tier of the United States and Canada not global warming. The flooding exceeded the floods of 1993 following the eruption of Pinatubo which produced a similar cooling with a strong suppressed jet stream that brought a steady stream of storms and flooding.
Rapid warming as took place in the 1930s and again around 1980 leads to drought and record heat. The alarmist movement is reeling after the warming stopped in 1998 and cooling began in 2002, accelerating in the last year. Their claims have now morphed from warming to focusing on the extremes typical of La Nina and the colder decades to try and keep their hoax alive.
See larger map here.
By John Brignell
“Men never do evil so completely and cheerfully as when they do it from religious conviction.” Blaise Pascal
It was Michael Crichton who first prominently identified environmentalism as a religion. That was in a speech in 2003, but the world has moved on apace since then and adherents of the creed now have a firm grip on the world at large. Global Warming has become the core belief in a new eco-theology. The term is used as shorthand for anthropogenic (or man made) global warming. It is closely related to other modern belief systems, such as political correctness, chemophobia and various other forms of scaremongering, but it represents the vanguard in the assault on scientific man.
The activists now prefer to call it “climate change”. This gives them two advantages: It allows them to seize as “evidence” the inevitable occurrences of unusually cold weather as well as warm ones. The climate is always changing, so they must be right. Only the relatively elderly can remember the cynical haste with which the scaremongers dropped the “coming ice age” and embraced exactly the opposite prediction, but aimed at the same culprit - industry. This was in Britain, which was the cradle of the new belief and was a response to the derision resulting from the searing summer of 1976. The father of the new religion was Sir Crispin Tickell, and because he had the ear of Prime Minister, Margaret Thatcher, who was engaged in a battle with the coal miners and the oil sheiks, it was introduced into international politics with the authority of the only major political leader holding a qualification in science. The introduction was timely yet ironic since, in the wake of the world’s political upheavals, a powerful new grouping of left-wing interests was coalescing around environmental issues. The result was a new form of godless religion. The global warming cult has the characteristics of religion and not science for the following reasons.
Faith is a belief held without evidence. The scientific method, a loose collection of procedures of great variety, is based on precisely the opposite concept, as famously declared by Thomas Henry Huxley: The improver of natural knowledge absolutely refuses to acknowledge authority, as such. For him, scepticism is the highest of duties; blind faith the one unpardonable sin. The global warmers like to use the name of science, but they do not like its methods. They promote slogans such a “The science is settled” when real scientists know that science is never settled. They were not, however, always so wise. In 1900, for example, the great Lord Kelvin famously stated, “There is nothing new to be discovered in physics now. All that remains is more and more precise measurement.” Within a few years classical physics was shattered by Einstein and his contemporaries. Since then, in science, the debate is never closed. Read the other reasons and much more of this essay here.
By Robert M. Carter, James Cook University, Townsville
The Wellington Climate Change and Governance conference succeeded in reinforcing the already strong public impression that dangerous human-caused climate change is occurring, and that this change can be prevented by limiting human emissions of greenhouse gas. However, to the degree that the conference was intended to contribute to a balanced public debate on human-caused global warming, it failed. The major sponsors of the conference included organisations whose charter includes the disinterested presentation of high-quality science, and civil social responsibility; these organisations failed in their duty of public care.
In addition, media coverage of the conference was “balanced” in only the most superficial way; news reports concentrated heavily on climate alarmism, and failed to follow up on the caveats which were expressed by the more responsible speakers at the conference. Troublesome ethical issues emerge, the most important of which include the role in society of scientific organisations and universities, and the way in which government-employed and other scientists are today constrained in the public comment that they can make on controversial issues of the day. Another major concern is the way in which scientific results are now routinely deployed into the public domain with a clear propaganda intent.
The Wellington climate conference displayed clearly the unacceptable price that society pays when it allows science to be corrupted by politicization. The future assessment of complex scientific and technological issues like climate change needs to be much more rigorously bias-proofed. At the very least this will require the routine use of counterweight and audit panels for rigorous verification of all major policy recommendations. These major conclusions about the Wellington climate conference apply also to many other similar climate meetings that are held around the world.” Read more here.
By Joseph D’Aleo, CCM
In the Seattle Times story Think it’s cold? You have good reason, Susan Gilmore reports “Seattle just experienced the coldest first week of June, according to climate records dating to 1891, said Cliff Mass, University of Washington meteorologist. “Just wait until tomorrow,” he said, when temperatures are going to be even colder. A heavy snow warning has been issued for the Washington Cascades and Olympics as a storm from the Gulf of Alaska plows into the state tonight. Forecasters with the National Weather Service said up to a foot of snow may fall in the mountains as low as 3,000 feet. In 30 years I can only remember two other times when it snowed this late in the season,” said Sam Krahenbuhl, Snoqualmie Pass assistant maintenance superintendent. “One time it snowed on a Fourth of July weekend. This is really rare."While it won’t snow in the Puget Sound area, records for the lowest high temperature may be broken today and Tuesday. In eastern Washington at Washington Sate University in Pullman, it snowed on June 10th.
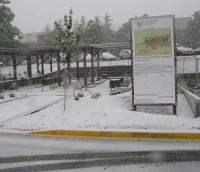
WSU Campus Pullman, WA, June 10, 2008
Mass added: “People are really upset about this weather."He said in the mix of all the statistics, he’s put together (with former Assistant State Climatologist Mark Albright) the “barbecue” index. That’s the number of times since March 11 (the usual start of spring here) temperature climbs to 60 degrees or more - a temperature that Mass thinks people are comfortable being outside in."It turns out that this year was the worst year of the barbecue index since 1917,” said Mass. “We only got to 60 degrees 23 times this year. Compare that to 1934 (74) times or 1992 (69) times."Mass said the coldest spring was 1917. This year is tied with 1908 for 2nd coldest, he said. The warmest spring was 1934.
Meanwhile The Aspen Skiing Company said Monday that it will open up Aspen Mountain from June 13 to 15 for skiers and snowboarders. The company says record winter snowfall has left the mountain covered with snow, leaving behind an average of more than 3 feet of snow on the upper slopes. And Missoula, Montana’s water park is closing due to cold weather ‘to protect children from hypothermia’ while Badger Pass recorded 40 inches of snow from June 10-12th.
Icecap Note: There has been plenty of cold air to go around this spring. The summer warmth has been suppressed south. This week the heat has has made an intrusion into the east as the cold air has dipped into the west. After a chilly start to the month in the northeast, the first 90 plus degree days of the season followed last weekend and early this week. Even though cold air is likely to continue to drop into the Pacific Northwest, some of the cooler air will increasingly make its way east and put an end to the current heat.
Ironically. just last week, Seattle’s mayor, Mayor Greg Nickels and his Seattle Parks and Recreation might do what even this week’s chilly weather couldn’t—douse the long tradition of beach bonfires at Alki and at Golden Gardens for fueling global warming! So poor Seattle folks can’t have bonfires because they contribute to global warming but can’t barbecue because it is too cold. You just can’t make this stuff up.
By Joseph D’Aleo, CCM
This spring has been extremely wet and stormy in the central states thanks to a suppressed La Nina jet stream and strong contrast from cold in the north to warmth in the deep south. Storms riding on the supercharged jet stream and feeding on the heat and moisture have produced severe weather and excessive rainfall. Tornadoes are in the news almost daily, most recently in Omaha. Rivers are in flood in parts of the Midwest where rainfall (well over 20 inches in the last 3 months in places) has even exceeded spring levels in the record flood season of 1993. That doesn’t necessarily mean that this year in the end will have more flooding than in 1993 but it does often have a lot to say about what the summer will be like.
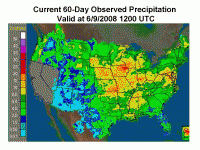
See large NOAA AHPS map here
There is a relationship between soil moisture and both precipitation and temperatures that becomes important in the spring and summer months. Forecasters pay close attention to this factor in their forecasts for summer. Soil moisture anomalies of significance tend to persist from spring to summer, except when major events like a landfalling hurricane act to intervene.
Very wet soils favor wetter summers and less extremes of heat (though not necessarily discomfort) in the summer, while very dry soils increase the chances of summer heat and drought. That is because wet soils and vegetation in the soil lead to more evaporation and transpiration of moisture, which is a cooling process that tends to hold daytime readings down. At night the elevated moisture content reduces the radiational cooling. With more moisture there may be more nighttime fog especially in valley areas and during the day more clouds, lower temperatures and better chances of showers from any lifting mechanisms. In this way wet areas favor more rainfall.
When the ground is very dry on the other hand, there is little evaporation and less plant transpiration especially if the water table is greatly lowered. The suns heat is more effective in warming ground temperatures. Higher temperatures and less moisture means lower humidity which desiccate the ground and vegetation further. There is less cloudiness and lifting mechanisms are much less effective in producing rainfall. In this way drought begets drought. Not surprisingly, there is a high persistence of soil moisture and Palmer Drought Indices from late spring into summer. See in this story why spring soil moisture is a good indicator of both summer rainfall and temperatures with example years.
The March-May spring season was the 36th coolest on record for the contiguous United States, according to an analysis by NOAA’s National Climatic Data Center in Asheville, N.C. Separately, last month ended as the 34th coolest May for the contiguous United States, based on records dating back to 1895.
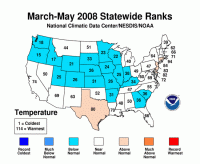
See full size map here
The average spring temperature of 51.4 degrees F was 0.5 degree F below the 20th century average. The average May temperature of 60.3 degrees F was 0.7 degree F below the 20th century mean, based on preliminary data.
For the spring, Missouri had its fourth wettest, Arkansas its sixth wettest, Indiana and Iowa their eighth wettest and Illinois its 10th wettest. For May, Arizona, Maryland, and Nebraska were much wetter than average, with Nebraska ranking fourth wettest and Maryland fifth wettest on record. California had its driest spring on record, while Nevada and Utah had their 10th and 11th driest on record.
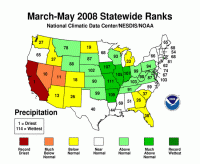
See full size map here
By Joseph D’Aleo, CCM
NOAA wants to establish a National Climate Service. Although more coordinated efforts and improvements are needed, NOAA has not shown the ability to accurately assess global temperatures nor look behind the discredited carbon driven climate change theory. Their one pager PDF says it all. Though they correctly noted the need to “clarify and consolidate information regarding the causes and effects of climate change”, they only show the CO2 trend and their faulty GHCN global temperatures. This is virtually the same bogus data set that NASA GISS uses that Steve Goddard (with help from Steve McIntyre) showed in the Register here was out of touch with reality as shown by satellites which cover the earth far better and are not subject to the siting and local urban contamination.
NCDC in 2007 removed an urban adjustment that their director, Tom Karl developed in 1988 in the version 2 of the USHCN data base. This exaggerated recent warming. Their global data base is a mess thanks to Peterson and Parker and major holes in the data. Steve Mcintyre has clearly shown the flaws in the studies by NCDC’s Tom Peterson (paper here) and the UK Hadley Center’s David Parker (paper here). Roger Pielke Sr. has done likewise on Climate Science numerous times including here . These studies have been used as excuses to minimize urban and local adjustments in the global data bases and support the politically correct warming. Also a recent paper in Nature showed how improper analysis of global sea surface temperatures occurred based on incorrect assumptions about the timing of a switchover from buckets to ship intake measurements. It was covered here. NOAA however deserves credit for the implementation of the 3000 global diving buoys that will provide better assessments of global ocean heat content, like the satellites a better way to assess climate change.
There is no acknowledgement of the need to address global data base deficiencies in the NOAA proposal. Nor is there any mention of other climate factors like the sun or ocean cycles (short-term like ENSO and longer term multidecadal like PDO and AMO). Like the some other foreign climate centers, they show they would focus on greenhouse forcing, which is now almost on a daily basis becoming discredited.
I see no need for a new multi million or billion dollar National Climate Service. I think they should focus existing centers like NCDC and CPC on developing improved methods for assessing accurate national and global climate changes, including a reconsideration of the possible roles of other factors like urbanization, land use changes, the sun and oceans in past and future climate change. See pdf of this blog with links here.


